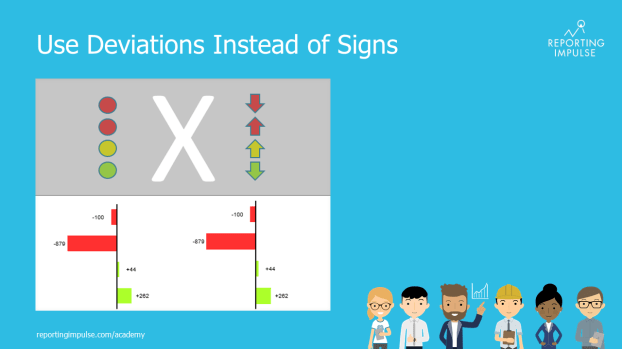
 At first glance, traffic lights seem to be a good idea – the signal colors are immediately understood, simple and everyone knows them from everyday life. However, a company cannot be equated with road traffic. It is much more complex, which is why more information has to be conveyed than individual terms such as „stop – attention – go“ or, as in our case, „good – medium – bad“. Traffic lights also do not convey how pronounced a tendency is and can even lead to wrong interpretations. There are several better alternatives to traffic lights. One of them is the representation of deviations in bars and columns in percentages or absolute values. Because of clear values and visualized characteristics, they say much more and thus offer a high added value.
This rule and others are explained in detail in the reportingimpulse Academy. Get Insights in our Visual Data Analytics Beginner’s Package here. In addition to our most important rules for dashboarding, it includes learning videos on the corresponding topic, book recommendations, reportingimpulse SharePics and much more.

The poster with all Information Design and Dashboarding rules:

