

 The quality of your dashboard depends on how well thought-out your storytelling is. However, the basic structure is always the same: from the overview on a landing page, you can access the detailed level(s) via filters or drill downs and finally the zoom level(s). Your storytelling concept should be based on the tasks, questions and experiences of your user group. These three aspects can be used to categorize users, as the contents of the individual groups also differ. For example, a manager needs fewer details and interactions than a data scientist who needs a lot of information to perform a thorough analysis.
This rule and others are explained in detail in the reportingimpulse Academy. Get Insights in our Visual Data Analytics Beginner’s Package here! In addition to our most important rules for dashboarding, it includes learning videos on the corresponding topic, book recommendations, reportingimpulse SharePics and much more.

The poster with all Information Design and Dashboarding rules:

 When you click through a dashboard and analyze the data, you’re reflecting on thoughts that can be very valuable to others. Wouldn’t it be helpful to capture them so the next person can build on them? That’s why commenting is an important functionality and should be actively used. Small reminder: Use the pyramid principle – first the central message, then the arguments. There are freestanding comments, usually on the right margin, and linked comments that refer to a certain value. Notes can also be placed in tables. Instead of highlighting, comments can also be linked to parts of the diagram using different colors. Guide the reader and provide additional information without commenting indiscriminately or excessively.
 This rule is derived from
 The integration of interactive activities into the dashboard offers many advantages. For example, a navigation bar helps you keep track of what’s going on as you drill down into deeper levels. It also serves as an intuitive control where you can skip any level. In addition, it helps to create and structure the dashboard, because every page needs a name and every path has to be defined. We recommend simplifying navigation and interaction as much as possible – three filters and three lines in the title concept are usually enough. Even within diagrams, interaction in the form of (combined) highlighting, mouse over or drill in functions provides a higher added value.
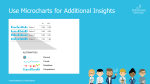
 As we already know, it is very advantageous to rely on information density. Micro charts are another instrument for this. The small diagrams are placed in a table or in a KPI tile and provide visual support for the information shown. The chart is chosen depending on the message to be conveyed (see
 To give structure to the dashboard and to ensure that the reader reads the most important information, attention should be paid to the reading direction (It may vary depending on the culture). There are different approaches – Gutenberg Diagram, Z-shape/ zick-zack-line or F-shape by Nielsen – they all have in common that the most important information should be in the top left corner. We recommend covering all four areas with a Z-shape. This will guide the reader through the dashboard.
 When it comes to the interactive use of diagrams for dashboards, many people stick to the classic diagrams. But the majority are unaware that there are alternatives that are particularly suitable for interactive environments. The treemap, for example, offers a good overview of the entire company and is always well received. Or how about the bullet graph? It integrates the popular traffic light logic but is made more complex and informative by adding a current value and a reference value. There are other good alternatives! Take a look at what the tool has to offer.
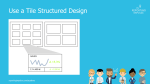
 Microsoft, Sony, Netflix and others all use the modern and intuitive tile structure. It is easily adaptable to different device sizes, from desktops to smartphones. Just as you want to have a preview of the Netflix series, it is also useful to have an overview of a data set. Tiles can have different layouts in dashboards. The simplest version is a link to the report – but the more information there is on the tile, the greater the added value.


 At first glance, traffic lights seem to be a good idea – the signal colors are immediately understood, simple and everyone knows them from everyday life. However, a company cannot be equated with road traffic. It is much more complex, which is why more information has to be conveyed than individual terms such as „stop – attention – go“ or, as in our case, „good – medium – bad“. Traffic lights also do not convey how pronounced a tendency is and can even lead to wrong interpretations. There are several better alternatives to traffic lights. One of them is the representation of deviations in bars and columns in percentages or absolute values. Because of clear values and visualized characteristics, they say much more and thus offer a high added value.

