

Andreas und Kai sprechen über modernes Dashboarding und wie Ansätze aus alltäglichen Anwendungen wie Netflix und Co. uns dabei helfen!
In dieser Folge lernt ihr:
- Welche Dashboardtypen es gibt
- Was eine einfache und intuitive Navigation in Dashboards ausmacht
- Warum Kacheln in keinem Guided Dashboard fehlen dürfen
- Wie Storytelling mit dem Ebenenkonzept für Dashboards funktioniert
- Warum Netflix und Co. als Inspiration für Business Dashboards so wichtig ist
Hier könnt ihr den Podcast hören und abonnieren:
Apple Podcast | Spotify | Google Podcast | Deezer
Folgt uns auch gern auf Instagram & Twitter:
reportingimpulse | dashboardheroes | BI_or_DIE | team_reporting
Wir freuen uns über eine Vernetzung auf LinkedIn:
+ + NEU + + +
Unser BI or DIE Magazin – Alle News regelmäßig im Überblick!
Hat euch die Folge gefallen? Dann gebt uns gern eine kurze iTunes-Bewertung!
Welche Fragen sollen wir demnächst stellen? Welche Interviewpartner möchtet ihr gerne hören? Schreibt uns gern eine E-Mail an info@reportingimpulse.com, über Twitter oder sprecht uns einfach direkt an!
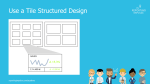
 Microsoft, Sony, Netflix and others all use the modern and intuitive tile structure. It is easily adaptable to different device sizes, from desktops to smartphones. Just as you want to have a preview of the Netflix series, it is also useful to have an overview of a data set. Tiles can have different layouts in dashboards. The simplest version is a link to the report – but the more information there is on the tile, the greater the added value.

